Dissertations, published posters, and the venues where I presented them.
Dissertations
Parsing Genetic Models
M.Sc thesis, Visual Computing Lab, supervised by Dr. Faisal Qureshi. Successfully defended January 6, 2022 at the University of Ontario Institute of Technology.
Applications of computer vision have seen great success recently, yet there are few approaches dealing with visual illustrations. We propose a collection of computer vision applications for parsing genetic models. Genetic models are a visual illustration often used in the biological sciences literature, used to demonstrate how a discovery fits into what is already known about a biological system. A system that determines the interactions present in a genetic model can be valuable to researchers studying such interactions. The proposed system contains three parts. First, a triplet network decides whether or not a figure is a genetic model. Second, the object detection network YOLOv5 is trained to locate regions of interest within genetic models using various deep learning training techniques. Lastly, we propose an algorithm that infers the relationships between the pairs of genes or textual features present in the genetic model.
Visual Computing Lab, supervised by Dr. Faisal Qureshi. Ontario Workshop on Computer Vision, April 21, 2021.
We propose a computer vision system for parsing gene model maps: visual illustrations, often used in the biological sciences literature, that demonstrate how a discovery fits into what is already known about a biological system. Our work comprises three parts. First, we train a triplet network to decide whether or not a figure is a gene model map, with Google Cloud Vision OCR extracting the text of the genes that occur within it. Next, we repurpose the architecture of YOLOv5, trained on our synthetic dataset of biological diagrams, to find locations of genes and relationships. Lastly, we propose a deep network that infers the relationships between the gene pairs present in the model. Components of this system power the search functionality of the Bio-Analytic Resource for Plant Biology tool at the University of Toronto.
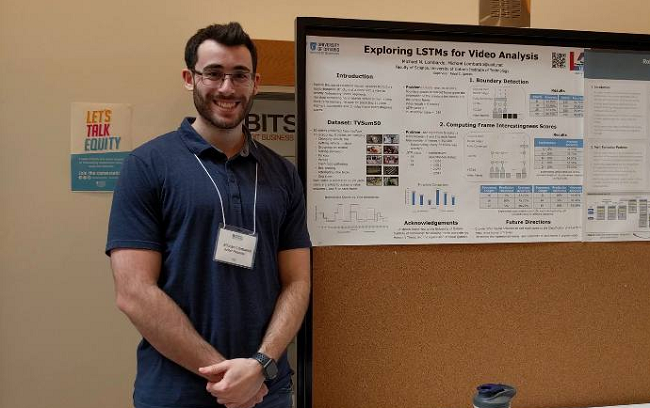
Visual Computing Lab, supervised by Dr. Faisal Qureshi. Ontario Tech University Undergraduate Honours Thesis Showcase, April 10, 2019.
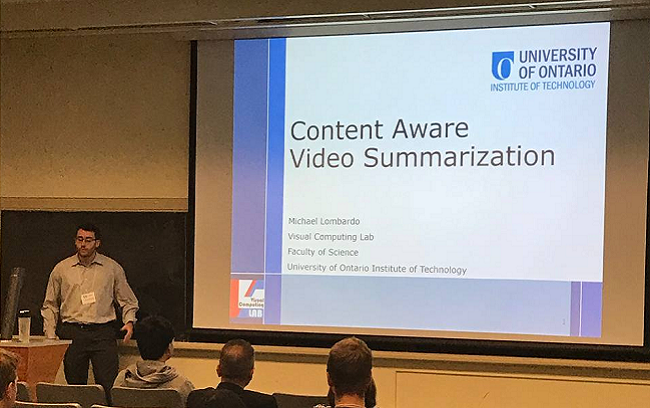
Video has rapidly become one of the most common and largest sources of visual information, and raw videos often require significant editing before they are best suited for viewing. State-of-the-art video summarization methods already generate high-quality summaries from raw video, so this honours thesis focuses on discovering new methods for video segmentation. I present experiments using long short-term memory (LSTM) cells to detect boundaries in a video and rate the interestingness of the final frame, given a sequence of frames. Using the TVSum50 dataset, I conclude that an LSTM-based model can learn temporal dependencies within a sequence of frames to successfully detect boundaries and rate the interestingness of a frame.
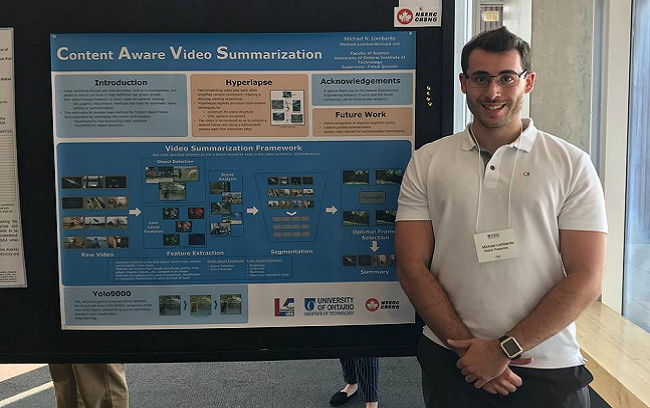
Visual Computing Lab, supervised by Dr. Faisal Qureshi. University of Ontario Institute of Technology Undergraduate Research Showcase, August 23, 2018.
The explosion of accessible video data through smartphones, video cameras, and webcams has brought us to an age of big video data. Although recording large amounts of video is nearly effortless, raw videos often require significant editing, and user-edited videos usually keep only the segments the editor deems interesting. State-of-the-art video summarization methods generate high-quality summaries from raw videos; this work asks how frame-level features can improve the summarization by changing the velocity of the video at different segments.
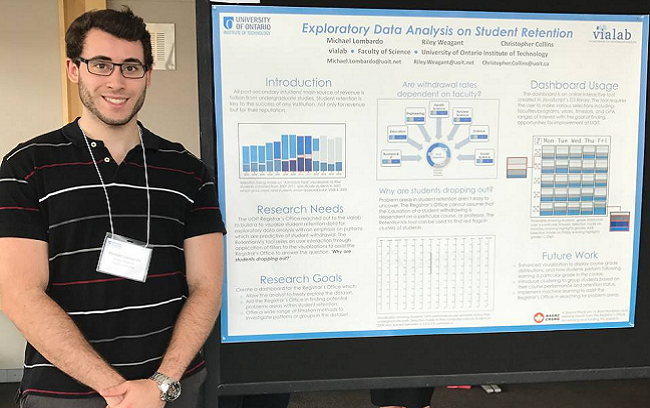
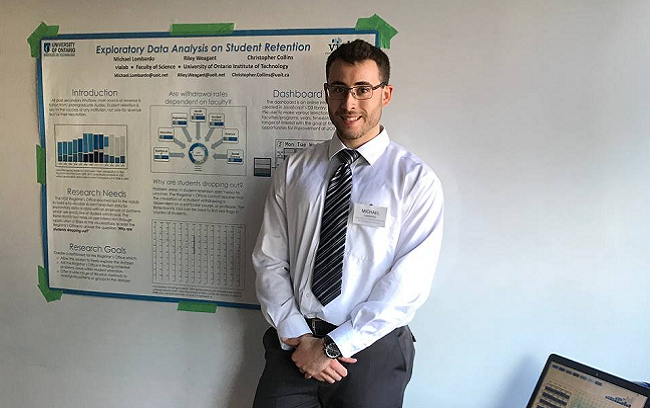
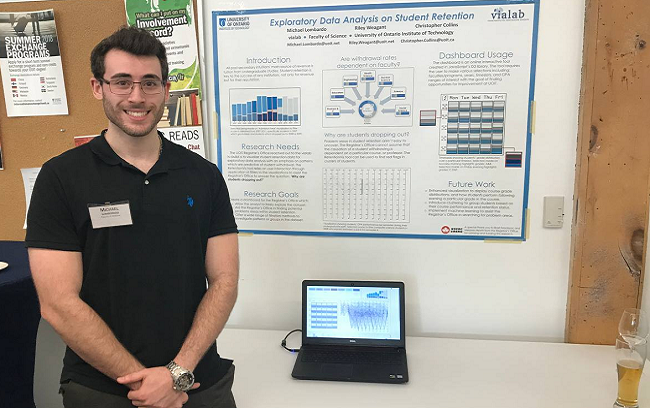
Visualization for Information Analysis Lab, supervised by Dr. Christopher Collins. University of Ontario Institute of Technology Undergraduate Research Showcase, August 23, 2017.
The UOIT Registrar's Office reached out to the Vialab to build a tool visualizing student retention data for exploratory data analysis, with an emphasis on patterns predictive of student withdrawal. The RetentionVis dashboard, an interactive D3 tool hosted by UOIT, relies on user interaction: filters across faculties and programs, years, timeslots, and GPA ranges help the Registrar's Office answer the question of why students drop out. Student retention is key to the success of any institution, both for revenue and for reputation.
Summer Undergraduate Research Showcase at Ontario Tech University, 2017Summer Undergraduate Research Showcase at Ontario Tech University, 2018Public Inc. Donor Appreciation Reception in Toronto, 2018Donor Appreciation Night in downtown Oshawa, 2018CSearch Conference at Queen's University, 2018Undergraduate Honours Thesis Showcase at Ontario Tech University, 2019